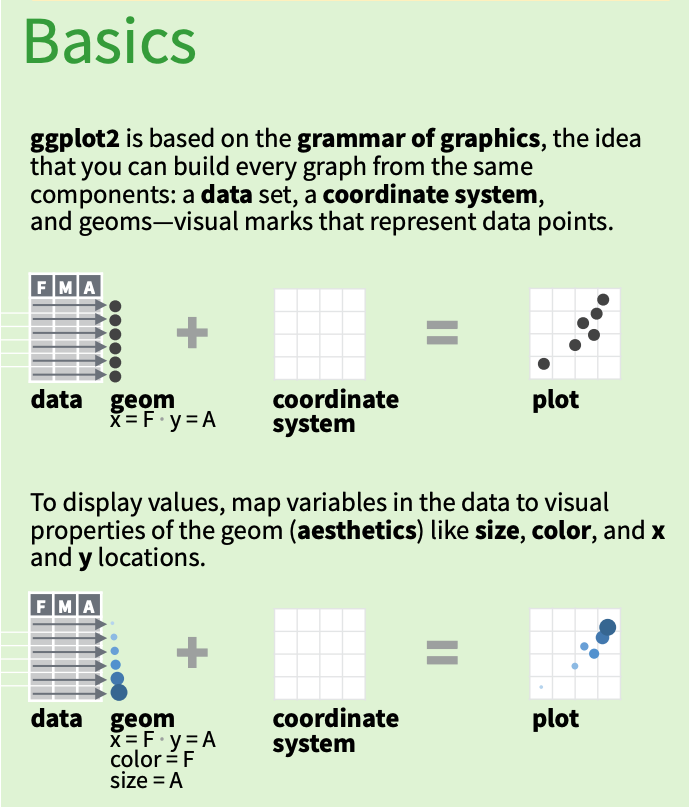
class: center, middle, inverse, title-slide # Week 5 ## Data visualization ### Dani Cosme --- ## Check-in ### Survey drafting * Messages have been created and the survey has been drafted -- * Good to go with our sampling plan -- Next steps: * Tasks to complete **today** * Nail down open ended questions using [this doc](https://docs.google.com/document/d/1_JyRfddJ4pByrOG-eOQQkfz7deR59yTjjS3O8Y-39l8/edit?usp=sharing) -- * Update the Qualtrics survey -- * Tasks to complete by **Monday, April 5** -- * Take the survey -- * Give feedback using [this doc](https://docs.google.com/document/d/1H1_B-Mrr-GyrhbHOlvRScAX0RNsa0T_9eG7xxSwVYug/edit?usp=sharing) --- class: center, middle ## Goal for this week Get our feet wet visualizing data in R using `{ggplot}`<br><br> --- ## Background [`{ggplot}`](https://ggplot2.tidyverse.org/index.html) is a package for plotting statistical graphics .pull-left[ * Based on the grammar of graphics: * Data * Coordinate system * Geoms: visual representations of the data (e.g. points, lines, bars) * Aesthetics: mappings between the data and geom properties ] .pull-right[ **`{ggplot}` cheat sheet graphic**  ] --- class: center, middle ## Let's walk through the [week5.Rmd](../labs/week5.html) code together --- ## Assignment -- 1. Run through the code we walked through together on your own in the `week5.Rmd` -- 2. Apply what you've learned in the assignment section of the `week5.Rmd` -- 3. Post to Slack for collective troubleshooting -- 4. Use the `week5_key.Rmd` to check your solutions