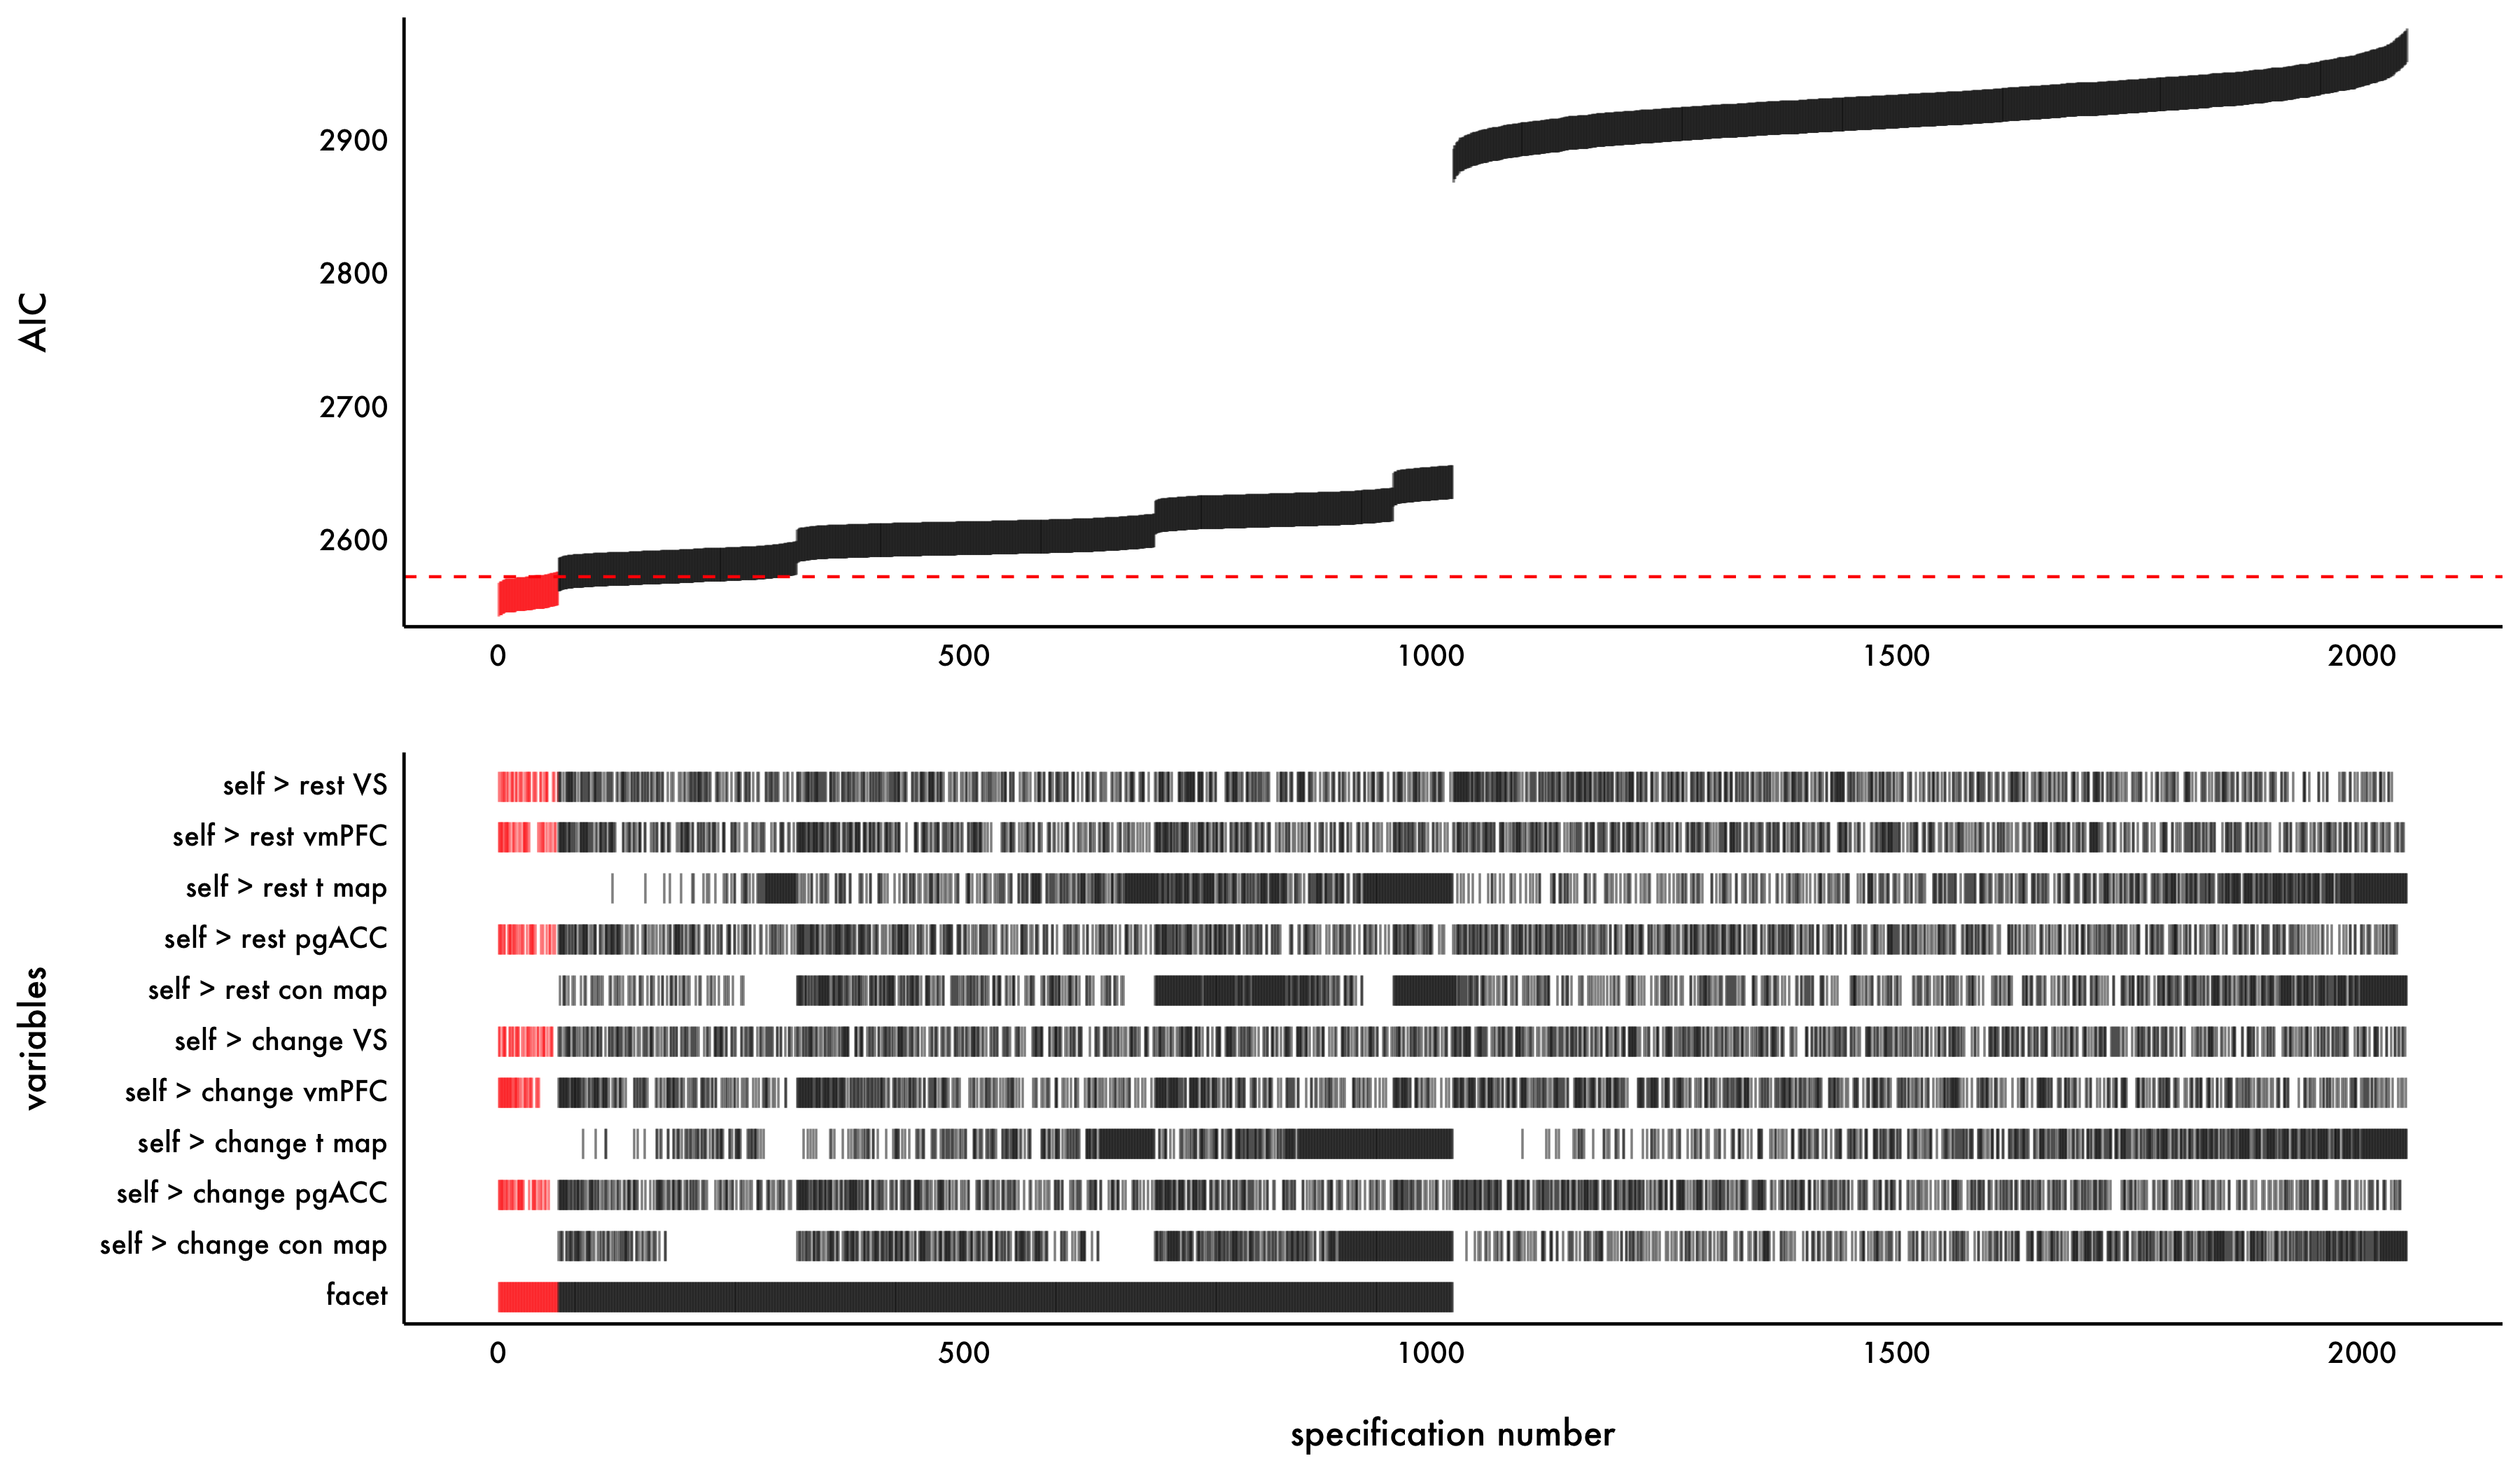
I was inspired by these amazing examples of specification curves by Julia Rohrer and Amy Orben, so I wrote some code to generate a curve like this:
Below is code to create a specification curve using a toy example from the airquality dataset. Enjoy!
load packages
library(tidyverse)
library(lme4)
library(MuMIn)
library(cowplot)
run models
Run all possible nested models using the dredge function from the MuMIn package.
# set na.action for dredge
options(na.action = "na.fail")

# omit NAs
airquality.na = airquality %>%
  na.omit()

# run full model
full.model = lm(Ozone ~ Solar.R + Wind + Temp + Month + Day, data = airquality.na)

# run all possible nested models
all.models = dredge(full.model, rank = "AIC", extra = "BIC") # rank based on AIC, but include BIC as well

# set AIC for null model you want to compare model AIC values to
null.AIC = 1025

# variables included in model
variable.names = names(airquality)[-1]
plot
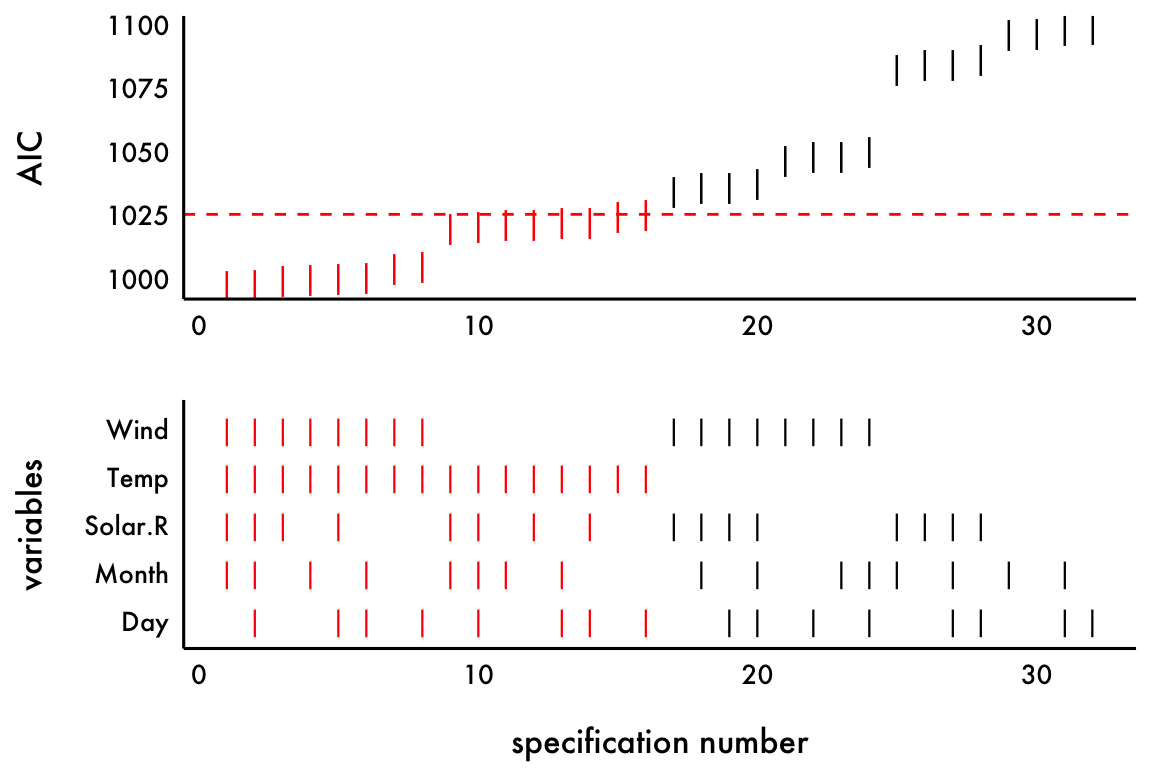
On the top panel, plot the AIC of each model and color based on whether each is a better fitting model than some comparator (e.g., the AIC for the null model). The bottom panel specifies which variables were included in each model in the top panel.
plot.data = all.models %>%
  arrange(AIC) %>%
  mutate(specification = row_number(),
         better.fit = ifelse(AIC < null.AIC, "yes", "no"))

top = plot.data %>%
  ggplot(aes(specification, AIC, color = better.fit)) + # color is based on whether model is better fitting than the null
    geom_point(shape = "|", size = 4) +
    geom_hline(yintercept = null.AIC, linetype = "dashed", color = "red") + # dashed line for null model AIC
    scale_color_manual(values = c("black", "red")) +
    labs(x = "", y = "AIC\n") +
    theme_minimal(base_size = 12) +
    theme(text = element_text(family = "Futura Medium"),
          axis.text = element_text(color = "black"),
          axis.line = element_line(colour = "black"),
          legend.position = "none",
          panel.grid.major = element_blank(),
          panel.grid.minor = element_blank(),
          panel.border = element_blank(),
          panel.background = element_blank())

bottom = plot.data %>%
  gather(variable, value, eval(variable.names)) %>% # gather predictor variables
  mutate(value = ifelse(!is.na(value), "|", "")) %>% # plot a line if included in the model
  ggplot(aes(specification, variable, color = better.fit)) +
    geom_text(aes(label = value), alpha = 1) +
    scale_color_manual(values = c("black", "red")) +
    labs(x = "\nspecification number", y = "variables\n") +
    theme_minimal(base_size = 12) +
    theme(text = element_text(family = "Futura Medium"),
          axis.text = element_text(color = "black"),
          axis.line = element_line(colour = "black"),
          legend.position = "none",
          panel.grid.major = element_blank(),
          panel.grid.minor = element_blank(),
          panel.border = element_blank(),
          panel.background = element_blank())

plot_grid(top, bottom, ncol = 1, align = "v")